Seguimiento y Visualización de OKRs: Herramientas y Estrategias
Clase 10 de 46 • Taller de Creación de Startups
Why use tools to track and visualize OKRs?
We recommend having a dashboard where you write down the company, team, individual OKRs. Visualization is an important aspect to implement the OKRs methodology and mindset successfully in your team for five main reasons:
- It gives clarity on the direction the company has to go.
- It provides transparency.
- It fosters responsibility.
- You can’t control what you don’t measure.
- It ensures historics and knowledge transfer.
Today there are plenty of ways and tools to help you visualize and keep track of OKRs (Weekdone, Monday, ZOKRI, Trello, Airtable, or the old school but user friendly, Google Spreadsheets). Each founder or team member will have his/her preferences. Therefore what matters is:
-
To Choose a Process you understand and you are confident about: choose a tool you feel comfortable to use and it's teachable.
-
To Keep It Simple, Keep it Lean: the more complexity, the harder it is to enforce the team to use the tool. The more tools (no matter how user friendly they might be), the more complex it is to be disciplined, track data. Often it is also more expensive.
-
Easy to check: people should give a daily look to their KR and update the progress. Have it in mind when you choose the process/tool you will use. Furthermore, the dashboard should be a support to run the OKR review meeting (that we recommend to host weekly or bi-weekly).
-
To Be honest with your process, If you push people to update their OKRs and results during the first quarter, maybe 50% of the team would not do it. It might be too complicated. Nothing is permanent, you can switch!
Three Example of OKRs Tracking Tools
CASE 1: THE SPREADSHEET Sometimes the simpler the better. At least in a phase of implementation, we don't recommend you spend your budget on the acquisition of an OKR tool before the team actually understands the methodology and “Buy it”.
At Platzi we simply use spreadsheets to define and track OKRs.
We have a “Mother Spreadsheet” with the OKR of the company called 2020_PLATZI_OKRS, in which you can find:
- Tab 1: OKR of the group per quarter
- Tab 2: the link to the OKR spreadsheet of each team (Sales, Success, Engineering, etc.)
- Tab 3: the chart of the team - organization of the different team and who they report to for the quarter (yes because it constantly changes ;) as we are in a dynamic world)
As just mentioned, then each team has its own spreadsheet with the name: 2020_PLATZI_OKRS:<<TeamName>>.
- Tab 1: OKR of the team
- Tab 2, 3, n: OKR per team member
The OKR format is easy to use as well:
CASE 2: THE PROJECT DASHBOARD (Trello, Asana, etc.) The second option to visualize and track OKR is to use project dashboard software such as Trello, Asana, or Monday.
We will share here a public example from the company Buffer which uses Trello Board.
How does Buffer leverage Trello, project management software to drive its OKRs process?
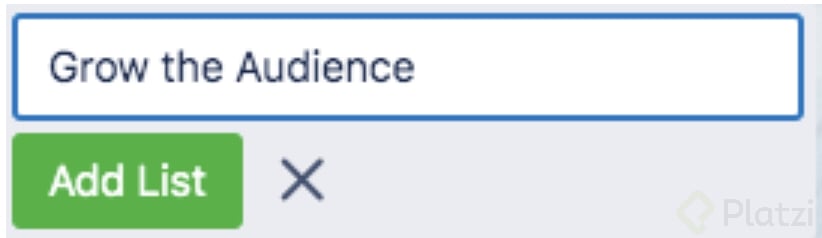
- Create a List for each objective:
The first step is to create a list named by the Objective, for better visualization the name can be summarised.
For Example: Grow the Audience by 50% -> Grow the Audience.
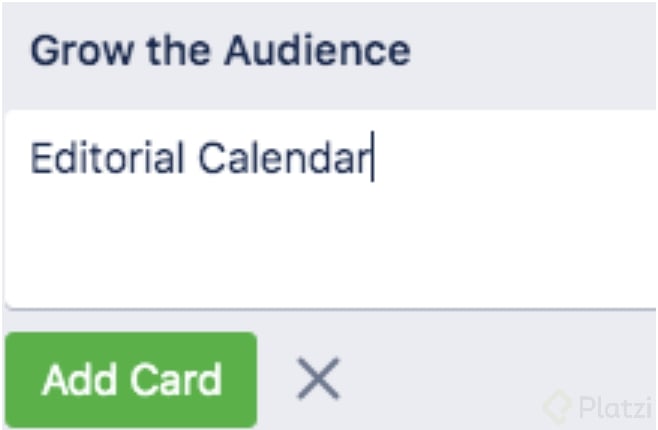
- Add key results linked to objective using a card.
The second step is to create a card related to the key results.
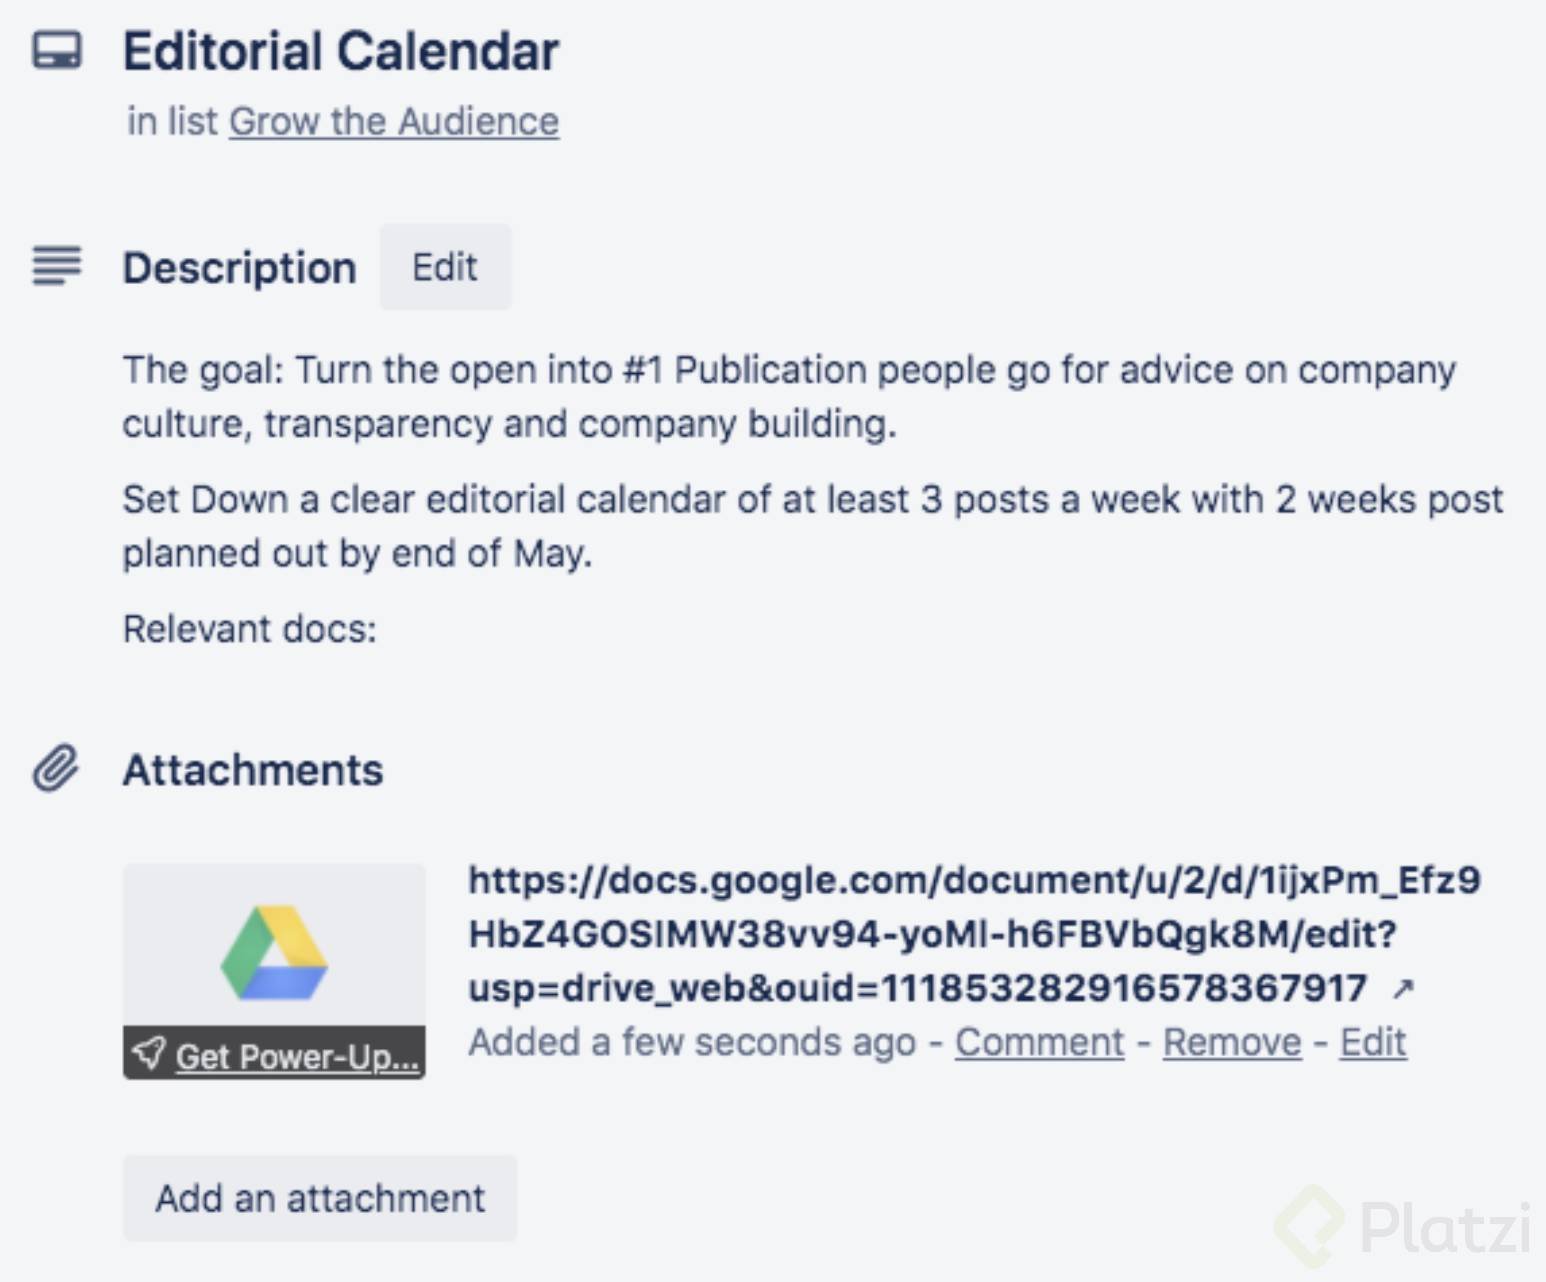
- Describe and add detail in each card:
- Purpose
- List of things to do (you can use the checklist and tag people).
- Related material/links
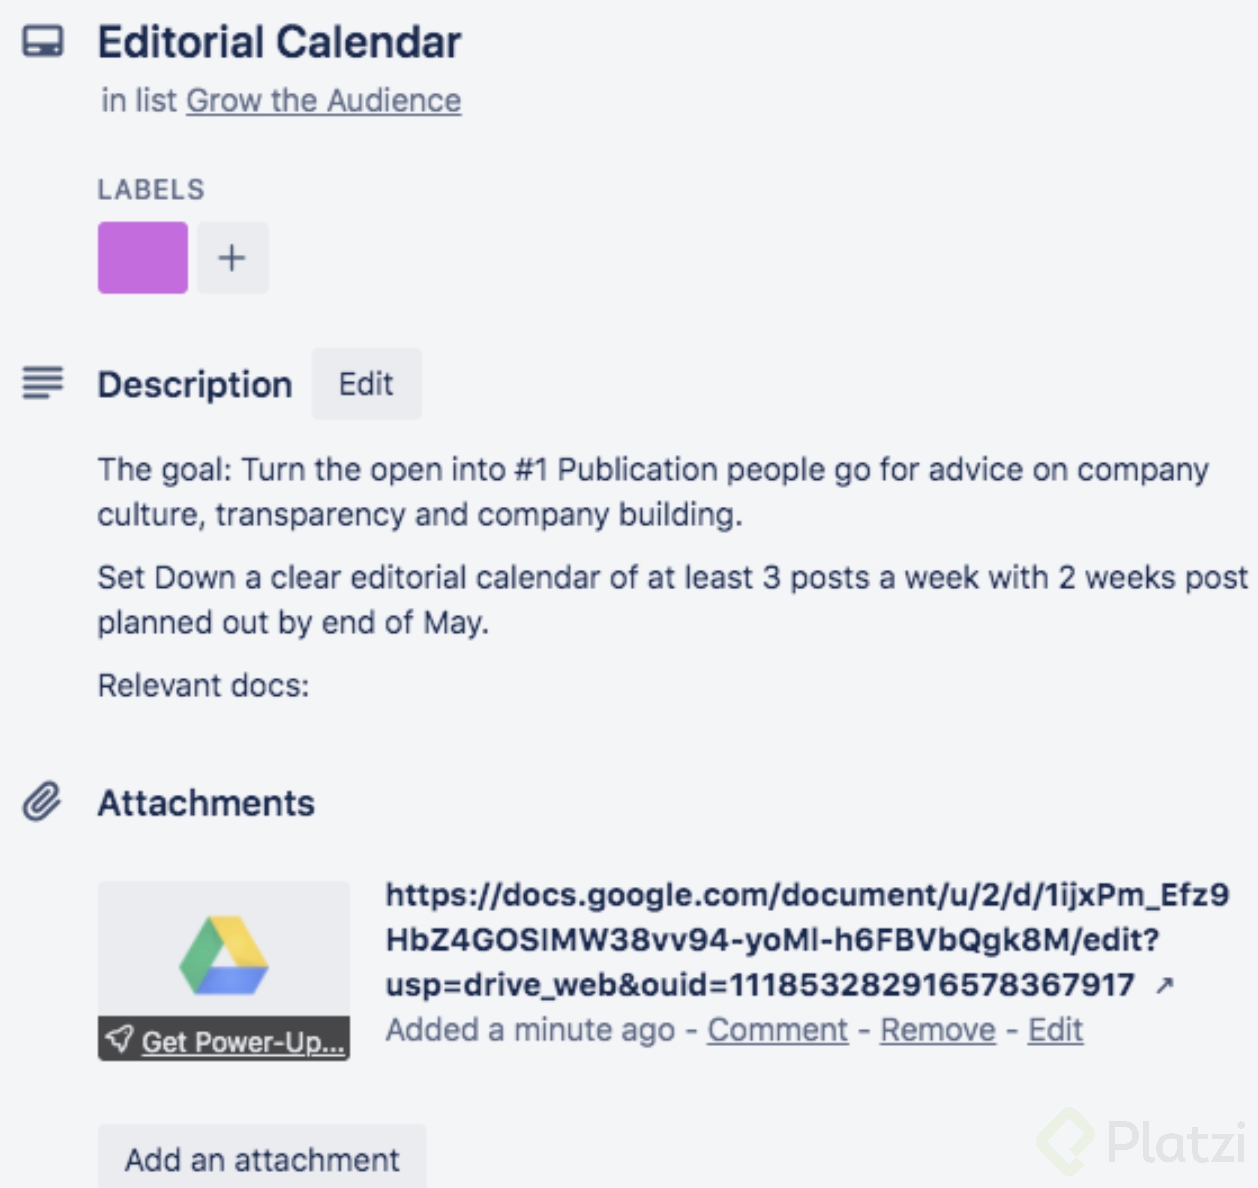
- Update the progress using labels The last step is to use labels to indicate the status of the progress of each KR.
Buffer used the following labels:
- Orange = Done (for now)
- Pink = In Progress
- Blue = Planning
- Green = Done
You can find the full case study on how Buffer uses Trello, on Trello’s Blog.
CASE 3: THE SOFTWARE (Weekdone, Zori, etc.)
Because OKR methodology is adopted by more and more corporate corporations like startups, this has created an opportunity for SAAS enterprises to build OKRs software management solutions. Nowadays there are hundreds of such software, we will share some insights on three of them: Weekdone, Gtmhub and Zokri.
Weekdone
Pricing: free from 1 to 3 users and the price changes accordingly to the number of users needed. Integration: with Chrome and Safari browser to make it always accessible from a toolbar icon.
Design:
- Tree format.
- Real-time visualization dashboard to track progress and Trend report.
- Conversation platform integrated, their aim is to encourage 1:1 meetings for OKR review, having all in one place.
- Work on a Mobile App.
Gtmhub
Pricing: propose 3 plans: start (1 USD per user) - Scale (5 USD per user) - Enterprise (12 USD per user). Provide a 7 days free trial.
Integration: propose over 90+ integrations among other Slack, Google Drive, Salesforce, Trello, Asana, Jira, MySQL, or Twitter.
Design:
- Tab Format with Objective on the left column and below the Key Results and Progress bar on the right.
- Possibility to set your own rules e.g. for the progress bar measurements, the maximum number of KR per objective, etc.
- Tracking views give the person responsible, due date and Status. Available in Table View of or Kanban format.
- Work on a Mobile App.
Source: @gtmhub on Twitter
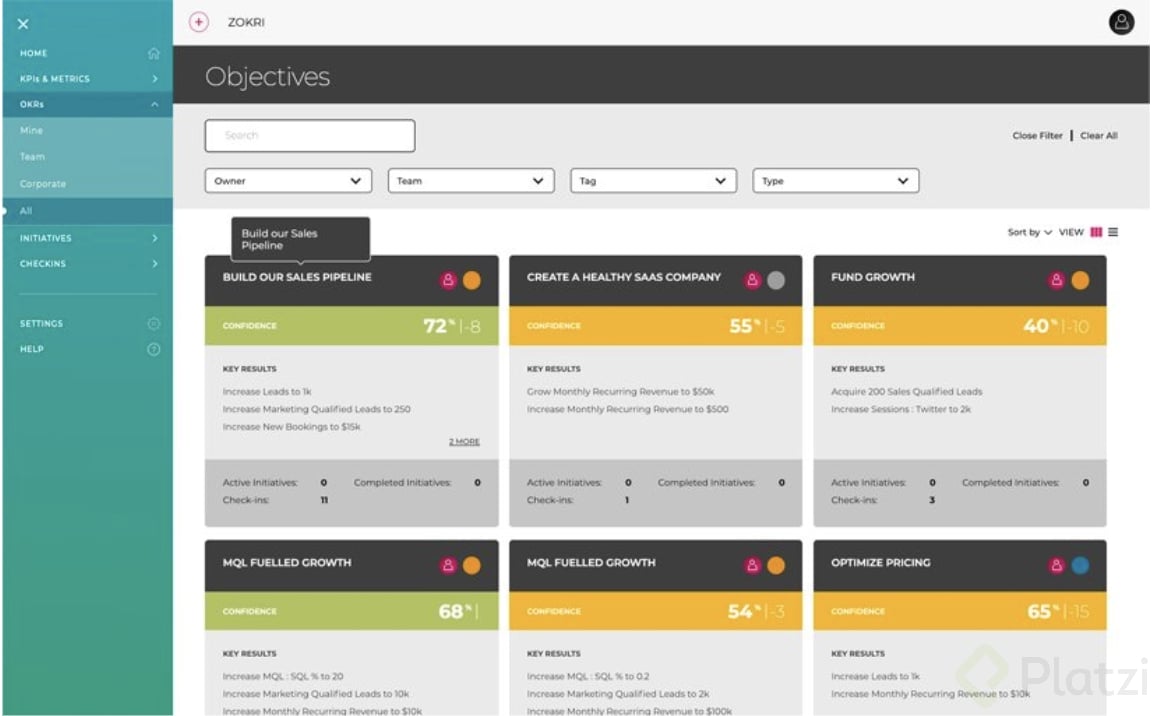
Zokri
Pricing: propose 2 plans - It’s free up to 4 users and then 10 dollars per month per user.
Integration: can be integrated with Google Analytics, Hubspot, Trello, or Asana.
Design:
- Dashboard with cards - it could be compared to the design of a marketplace.
- The card is named with an objective and inside are the KR as well as the number of check-ins done and status of the initiative.
- Possibility to switch the view from individual, team, and organization objective.
Source of picture: @Zokri_app on Twitter
They also provide advisory and have free online content and videos to teach OKRs methodology.
Pavel Pichardo, CEO of the startup Madison (Dominican Republic) chosen Zokri for:
- The simplicity of use
- The hundreds of premade key results to adapt and use
If you want to check other software and run a comparison, you can use Capterra, a comparator of software.
Summary
In this class, we have learned why it is important to keep track of the OKRs in a place that allows us to visualize the OKRs. This place could be a simple document, spreadsheet, board, a software dedicated to the management of OKRs or why not your own In-house built dashboard. We have seen that tracking your OKRs will help:
- To give clarity on the direction the company has to go.
- To provide transparency.
- To foster responsibility and accountability.
- To control and adapt considering we can’t control what you don’t measure.
- To ensure historics and knowledge transfer.
We recommended choosing a process that:
- You feel comfortable with and that you trust.
- It is easy to use and check. In any case and at any time, you can switch the tool or platform you are using to track and visualize your OKRs. Just keep in mind that the change of the process is painful so better that there is a relevant reason to the switch.
Finally, we presented 3 examples of means to track and visualize your OKRs:
- A Spreadsheet.
- A Project Dashboard.
- A software specially built to track OKRs.
Time to work! ;)