Fast pages keep users. If your site takes more than five seconds to load, the chance of users dropping off is high. Here you’ll see how to audit with Google Page Speed Insights and Lighthouse, interpret the report, and apply targeted fixes like lazy loading and deferring to improve a React landing page with an interactive p5.js background and third‑party analytics. The outcome: performance up and load time halved from 0.8s to 0.4s.
Why do page speed insights matter for your app?
A quick audit after building or designing a web app confirms it loads fast and feels smooth. The goal is simple: keep users from leaving and help them understand, act, and sign up without friction. Page Speed Insights highlights four key scores—performance, accessibility, best practices, SEO—and you generally want them green.
What initial checks protect user experience and sign-ups?
- Verify first load: users should see content fast and not get annoyed.
- Target both devices: test mobile and desktop; choose what your users use most.
- Aim for green scores: performance, accessibility, best practices, SEO.
- Watch for early blockers: heavy backgrounds or scripts can delay first paint.
How to audit with Google Lighthouse and Page Speed Insights?
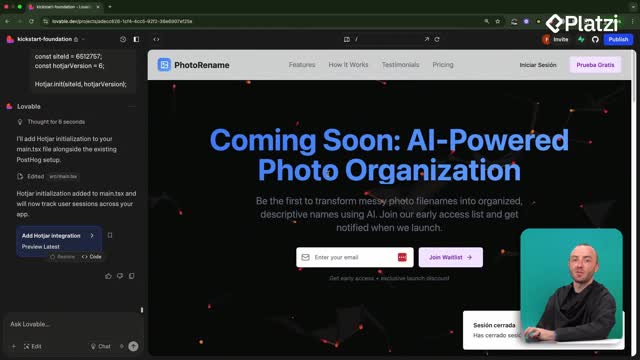
You can run the Chrome Lighthouse extension or use the Page Speed Insights website. Choose device, generate a report, then review issues and opportunities. Example context: a photo renaming app landing page at photorename.fun (later published to photorener.app) was tested on desktop due to likely computer‑based users.
What common issues did Lighthouse reveal?
- Unused JavaScript: code that ships but isn’t needed immediately.
- Render‑blocking requests: resources that delay page rendering.
- Large JavaScript bundle: React apps often load a lot by default.
- Third‑party analytics: Posthog and Hotjar add to load time.
- Hero image size: even at ~120 KB, could be smaller or better optimized.
- Missing resource pre‑connections: no early connections to critical origins.
- CSS blocking: a CSS file slowing initial render.
- p5.js interactive background: a nice effect, but heavy at first load.
How do you turn the report into an actionable plan?
- Use chat mode in Lovable: paste the full Lighthouse report.
- Confirm priorities: keep the p5.js animation, but load it after the page.
- Iterate the plan: ensure noncritical parts and analytics are deferred.
- Validate scope: keep all app and landing page functionality intact.
Which fixes improved performance and how to apply them?
The plan focused on loading what matters first, then everything else. After implementing changes, the page felt “slicker and faster,” with sections rendering on scroll and the background loading after content. Results confirmed it: performance improved and load time dropped from 0.8s to 0.4s.
What to load first vs later?
- Load immediately: hero and navbar for instant context.
- Lazy load noncritical components: use React lazy techniques for below‑the‑fold content.
- Defer heavy visuals: keep the p5.js animation but load after the page is ready.
- Defer analytics: move Posthog and Hotjar into a component that loads post‑onload.
What asset and network optimizations help?
- Resize and convert images: shrink the hero image further if possible.
- Reduce unused JavaScript: cut or delay code that isn’t needed upfront.
- Address render‑blocking: minimize blocking CSS and scripts.
- Add pre‑connections: preconnect to critical origins to speed up resource fetches.
How to implement safely and verify gains?
- Let Lovable apply the plan: it made ~20–25 code changes.
- Fix build errors fast: use Try to Fix when small issues appear.
- Publish with care: review security warnings before pushing updates.
- Re‑test with Page Speed Insights: confirm score gains and faster loads.
Key takeaways from the changes: lazy loading, deferring noncritical scripts, optimizing assets, and staggering heavy effects can dramatically improve real and perceived speed. React apps carry JavaScript overhead, so there’s a limit, but the experience can still be very fast—here, down to 0.4s. Keep iterating through Google’s diagnostics and prompt Lovable for focused improvements.
Have questions about using Lighthouse, deferring analytics, or lazy loading p5.js? Share your context and what scores you’re seeing; let’s refine your plan together.