import pandas as pd
import matplotlib.pyplotas plt
plt.style.use("dark_background")for param in['text.color','axes.labelcolor','xtick.color','ytick.color']: plt.rcParams[param]='0.9' # very light grey
for param in['figure.facecolor','axes.facecolor','savefig.facecolor']: plt.rcParams[param]='#212946' # bluish dark grey
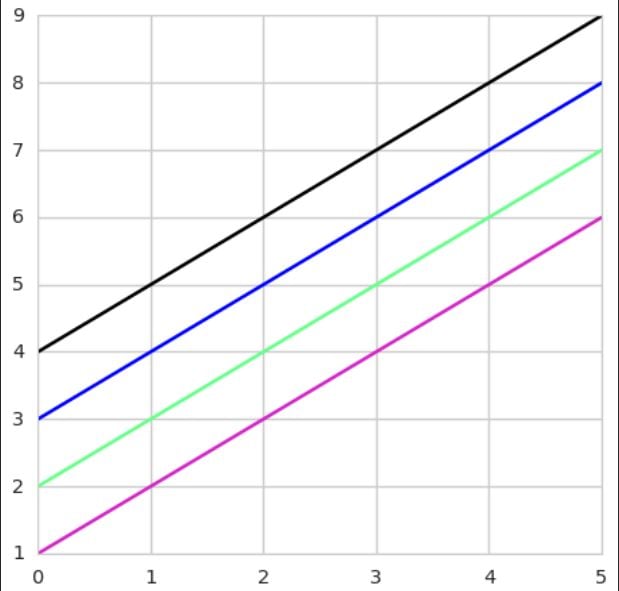
colors =['#08F7FE', # teal/cyan
'#FE53BB', # pink
'#F5D300', # yellow
'#00ff41', # matrix green
]df = pd.DataFrame({'A':[1,3,9,5,2,1,1],'B':[4,5,5,7,9,8,6]})fig, ax = plt.subplots()df.plot(marker='o', color=colors, ax=ax)# Redraw the data with low alpha and slighty increased linewidth:n_shades =10diff_linewidth =1.05alpha_value =0.3/ n_shades
for n inrange(1, n_shades+1): df.plot(marker='o', linewidth=2+(diff_linewidth*n), alpha=alpha_value, legend=False, ax=ax, color=colors)# Color the areas below the lines:for column, color inzip(df, colors): ax.fill_between(x=df.index, y1=df[column].values, y2=[0]*len(df), color=color, alpha=0.1)ax.grid(color='#2A3459')ax.set_xlim([ax.get_xlim()[0]-0.2, ax.get_xlim()[1]+0.2]) # to not have the markers cut off
ax.set_ylim(0)plt.show()
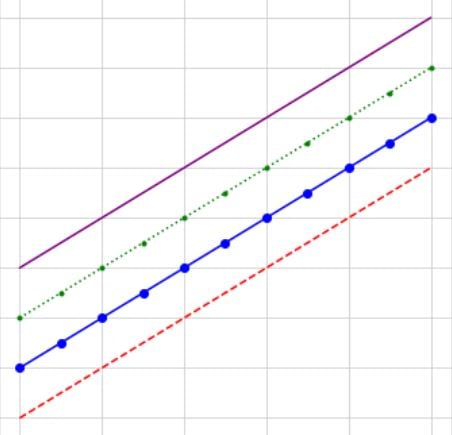
Buen día mis estimados!
Pueden usar este código para poder visualizar los colores de forma mas bonita :).
fig, ax = plt.subplots(figsize =(3,3))ax.plot(x,x+1,color ='purple',linewidth=20)ax.plot(x,x+2, color ='blue',linewidth=20)ax.plot(x,x+3,color ='lightblue',linewidth=20)ax.plot(x,x+4, color ='green',linewidth=20)ax.plot(x,x+5,color ='yellow',linewidth=20)ax.plot(x,x+6, color ='orange',linewidth=20)ax.plot(x,x+7,color ='red',linewidth=20)ax.axes.get_xaxis().set_visible(False)ax.axes.get_yaxis().set_visible(False)plt.show()
Mi aporte
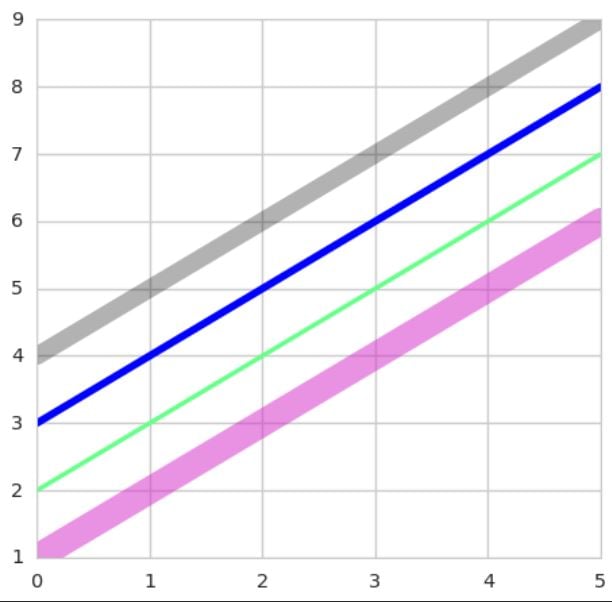
Una visualización que hice sobre varias funciones:
Estuve investigando un poco más sobre los estilos y noté que literalmente se puede personalizar todo.
Resultado:
Código:
fig, ax = plt.subplots(figsize =(6,6), facecolor=(.18,.31,.31)) # Parte externa
ax.set_facecolor('#eafff5') # Parte interna
ax.set_title('LINE', color='peachpuff')ax.set_xlabel('x', color ='c')ax.set_ylabel('y', color ='c')ax.tick_params(labelcolor='orange') #Parámetros del gráfico
ax.plot(x,x,color ='#D426C8', alpha=0.5, linewidth=18)ax.grid(True) #grilla
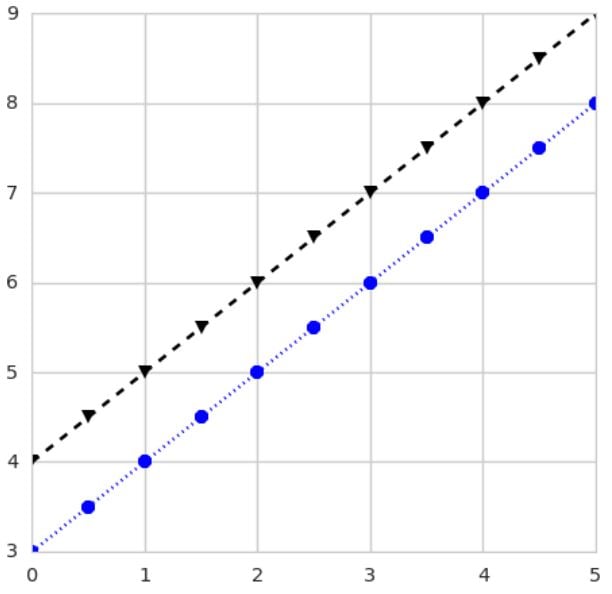
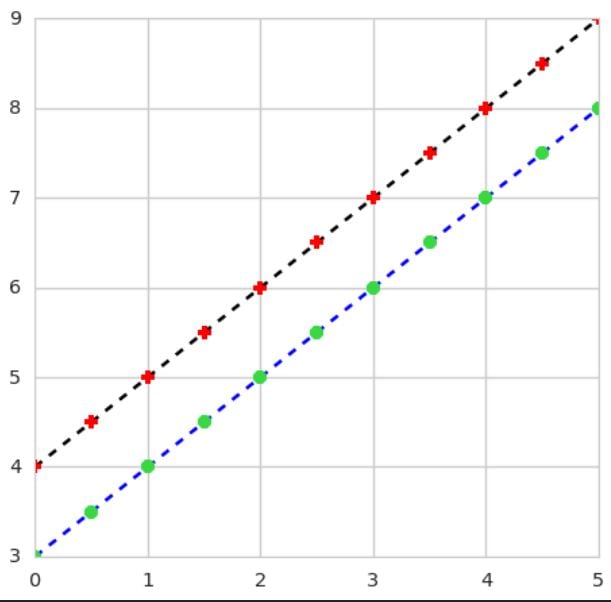
¿Los marker en modo MATLAB también se pueden personalizar?
color y tamaño, pero es mucho mejor en estilo pyplot
Es posible combinar método matlab y pyplot:
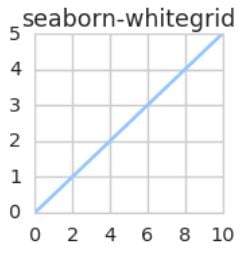
Con este hack podrán ver todos los estilos aplicados y sus respectivos nombres arriba de cada gráfico.
for i in plt.style.available:
plt.style.use(i)
print(i)
fig, ax = plt.subplots(figsize=(5,5))
ax.plot(x)
plt.show()
Hola comunidad, alguien sabe que unidad de medida usa mathplotlib cuando se indica el amaño de una figura o axes???, son cm, mm, px,...???
Saludos y de antemano gracias.
Mathplotlib usa unidades de pulgadas para especificar el tamaño de una figura o ejes. Para especificar el tamaño, se puede usar la función "figure(figsize=(width, height))" o el argumento "figsize" al crear una figura. Por ejemplo:
En este ejemplo, la figura se crea con un ancho de 8 pulgadas y un alto de 6 pulgadas. También es posible ajustar el tamaño de los ejes individuales usando el método "set_size_inches(width, height)" en el objeto "Axes". Por ejemplo:
En este ejemplo, el tamaño de los ejes se ajusta a 6 pulgadas de ancho y 4 pulgadas de alto.
Hola, estoy trabajando en un código para visualizar todos los estilos que hay en plt.style.available en un solo LIENZO(fig) poniendo un estilo del array a cada AXES(ax). Pero no lo he logrado, alguien me puede ayudar? este es el código:
x = np.linspace(0,5,11)y = x**2contador =0fig, ax = plt.subplots(4,7, figsize=(20,20))for i inrange(0,4,1):for j inrange(0,7,1): ax[i,j].plot(x, y) plt.style.use(plt.style.available[contador]) contador +=1
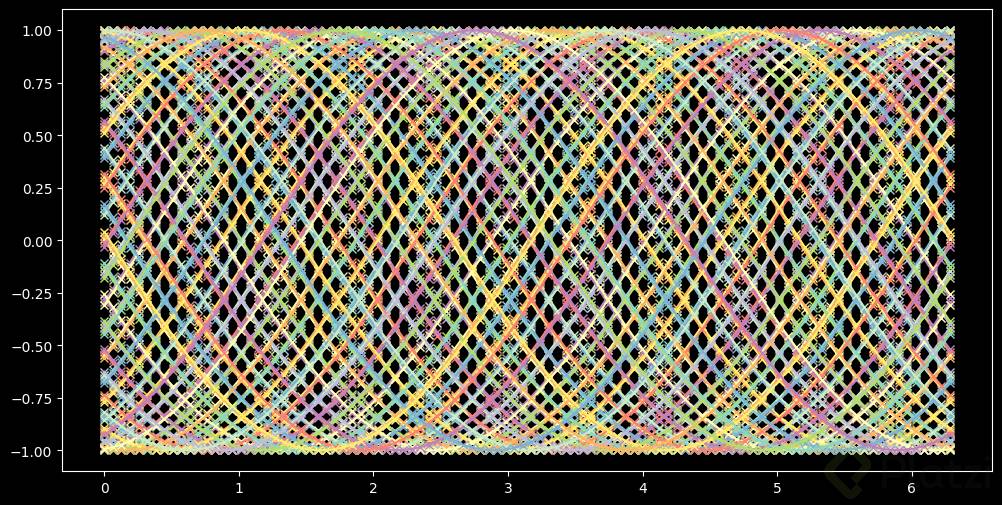
Existe alguna funcionalidad para suavizar la curvatura de las lineas?
import numpy as np
import matplotlib.pyplotas plt
from matplotlib.animationimportFuncAnimation# Datos de ejemplo
#x = np.linspace(0,2* np.pi,100)# Crear la figura y los ejes
fig, ax = plt.subplots(figsize=(12,6))# Inicializar las líneas
lines =[]for i inrange(100): line,= ax.plot(x, np.cos(x - i), marker='x') lines.append(line)# Función de actualización para la animación
def update(frame):for i, line inenumerate(lines): line.set_ydata(np.cos(x - i - frame *0.5))return lines
# Crear la animación
ani =FuncAnimation(fig, update, frames=np.arange(0,100), blit=True)# Mostrar la animación
#plt.legend()plt.show()```![]()