Clase 17
EDA con Histogramas
.
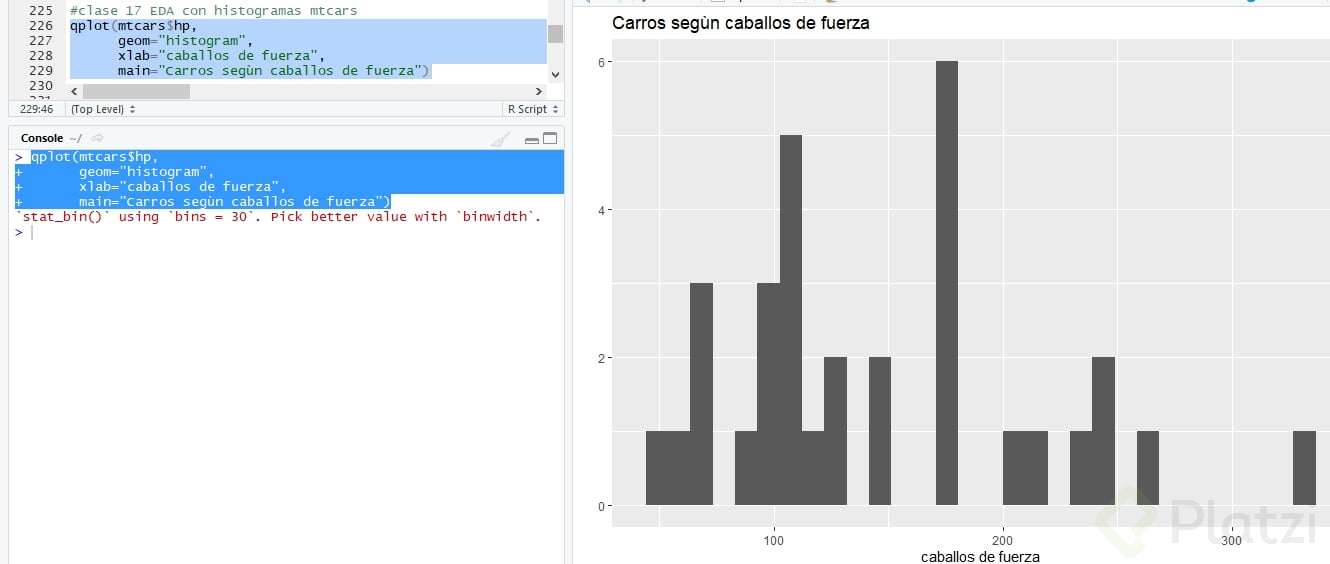
En esta clase se explican 3 maneras diferente de graficar en R el mismo histograma del nº de "Caballos de fuerza en carros seleccionados". Teniendo qplot() y dos opciones desde ggplot().
.
Ten en cuenta que puedes cambiar:
color de fondo 📉
color de las barras del histograma 🌈
el ancho de las barras 📊
y ajustar la escala de cualquier eje (x,y) 📐
.
.
OPCION 1
qplot($)
geom="histogram"
xlab=
main
 .
.
OPCION 2
.
ggplot( , aes(x=))
geom_histogram()+
labs(x="", y="",
title="")
 .
AQUI PUEDES CAMBIAR EL COLOR DE FONDO. DE GRIS PASO A BLANCO 📉
.
ggplot( , aes(x=))
geom_histogram()+
labs(x="", y="",
title="")+
theme(legend.position= "none")+
theme(panel.background = element_blank(), panel.grid.major = element_blank(),
panel.grid.minor = element_blank())
👇👇👇
 .
Y EL AJUSTE EN EL ANCHO DE LA BARRA O (binwidth=) PARA QUE EL INTERVALO SEA MAYOR Y SE VEA UNA BARRA MAS ANCHA 📊
.
ggplot( ,aes(x=))
geom_histogram(binwidth=30)**+
labs(x="",y="",
title="")+
theme(legend.position="none")+
theme(panel.background = element_ (), panel.grid.major = element_ (),
panel.grid.minor = element_ ())
👇👇👇
 .
.
OPCION 3
.
ggplot() + geom_histogram(data= ,
aes(x=hp), fill""=, color="",
binwidth =) +
labs(x=, y=,
title="")+
xlim(c( , ))+
theme(legend.position = "none")+
theme(panel.background = element. (), panel.grid.major = element_ (),
panel.grid.minor = element_ ())
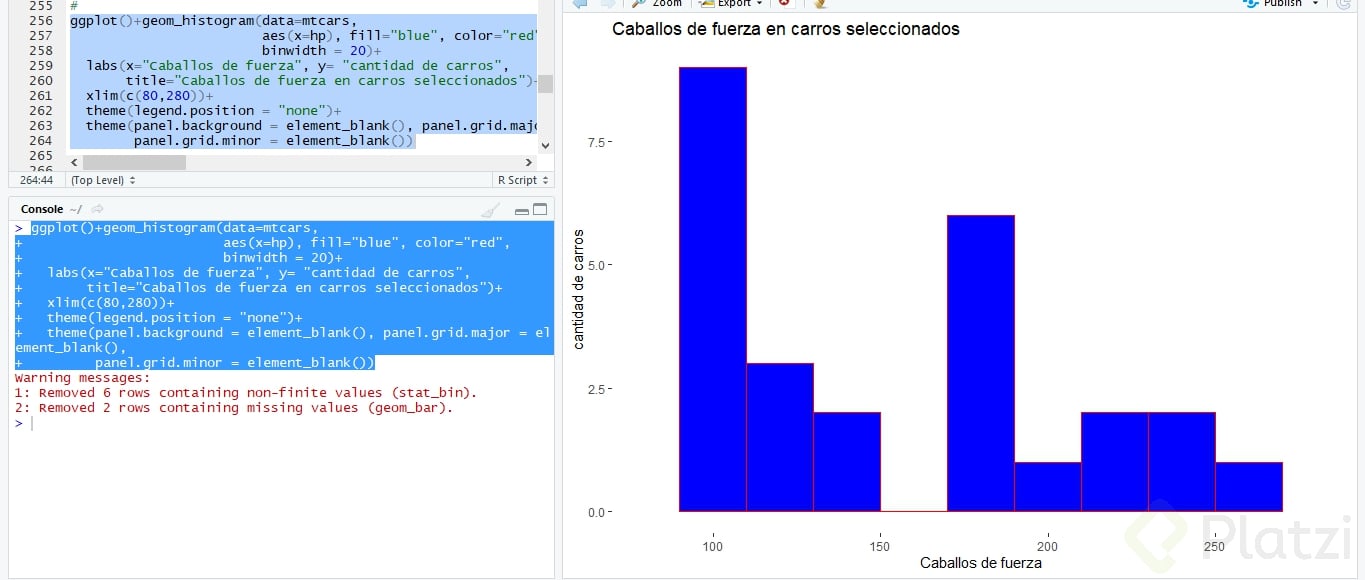 EN ESTE ggplot SE HIZO UN AJUSTE EN LAS ESCALAS DEL EJE X 📐. Y SE HA PUESTO COLOR🌈 EN LAS BARRAS DEL HISTOGRAMA




 .
.
D E F I N I C I O N E S
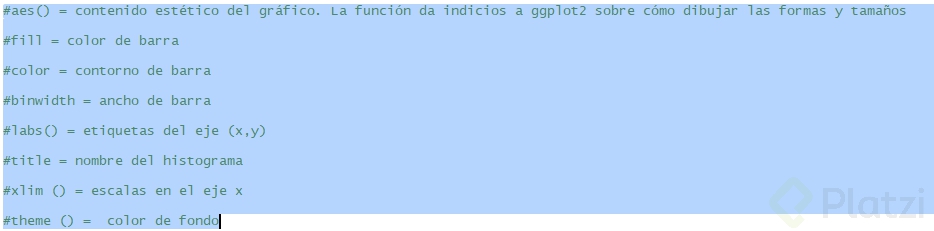
aes () = contenido estético del gráfico. Es decir, la función le dará indicios a ggplot2 sobre cómo dibujar las formas y tamaños
.
fill = color de barra
.
color = contorno de barra
.
binwidth = ancho de barra
.
labs () = etiquetas del eje (x,y)
.
title = nombre del histograma
.
xlim () = escalas en el eje x
.
theme () = color de fondo