

Comparando los 3
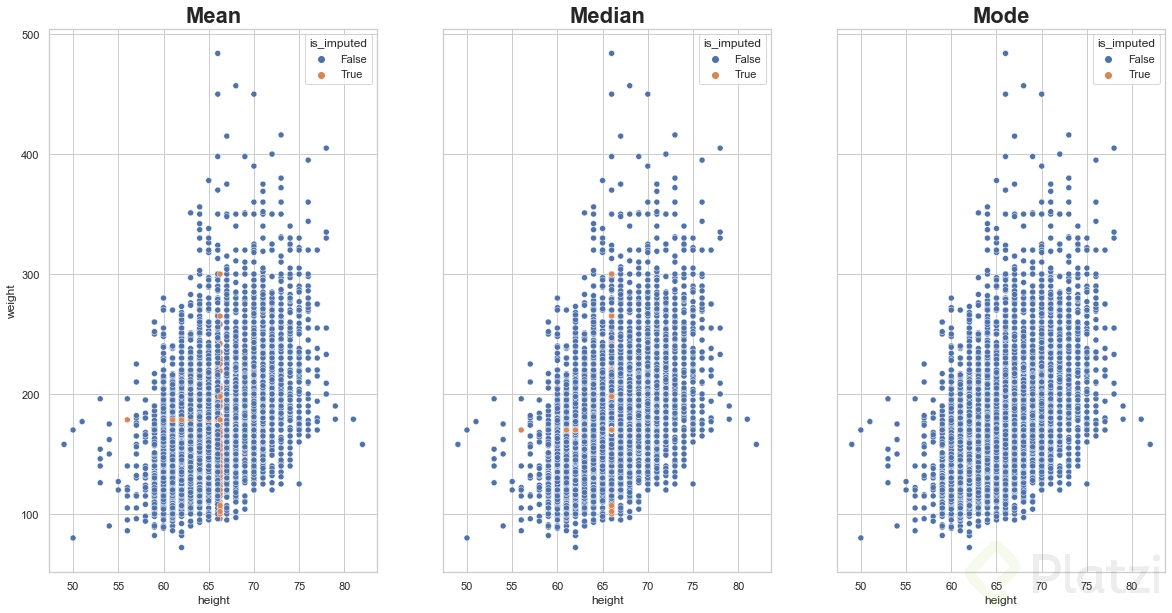
fig, ax = plt.subplots(1,3,figsize=(20,10), sharey=True)
(
    nhanes_df
    .select_columns("height", "weight")
    .missing.bind_shadow_matrix(True, False, suffix= "_imp")
    .assign(
        height = lambda df: df.height.fillna(value = df.height.mean()),
        weight = lambda df: df.weight.fillna(value = df.weight.mean())
    ).missing.scatter_imputation_plot(
        x="height",
        y="weight",
        # show_marginal = True,
        # height = 10,
        ax=ax[0]
    )
),
(
    nhanes_df
    .select_columns("height", "weight")
    .missing.bind_shadow_matrix(True, False, suffix= "_imp")
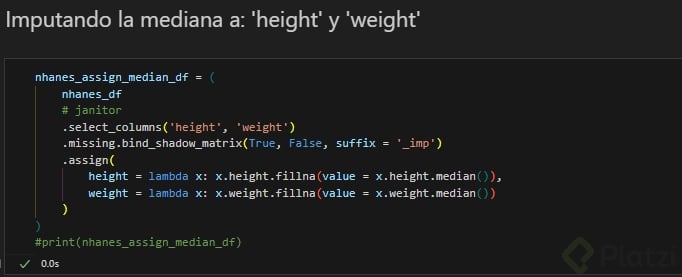
    .assign(
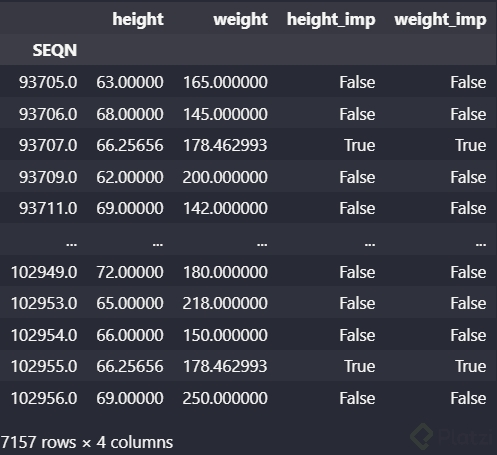
        height = lambda df: df.height.fillna(value = df.height.median()),
        weight = lambda df: df.weight.fillna(value = df.weight.median())
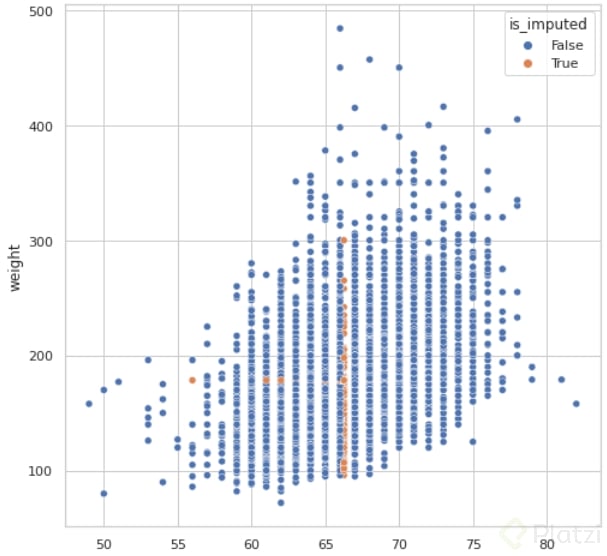
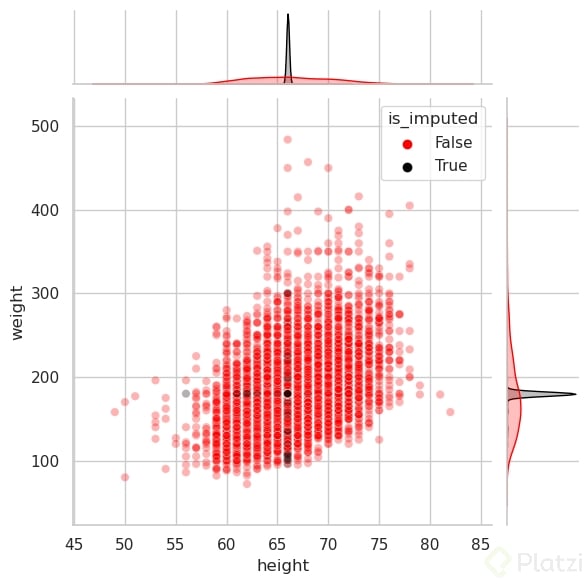
    ).missing.scatter_imputation_plot(
        x="height",
        y="weight",
        # show_marginal = True,
        # height = 10,
        ax=ax[1]
    )
),
(
    nhanes_df
    .select_columns("height", "weight")
    .missing.bind_shadow_matrix(True, False, suffix= "_imp")
    .assign(
        height = lambda df: df.height.fillna(value = df.height.mode()),
        weight = lambda df: df.weight.fillna(value = df.weight.mode())
    ).missing.scatter_imputation_plot(
        x="height",
        y="weight",
        # show_marginal = True,
        # height = 10,
        ax=ax[2]
    )
),
ax[0].set_title("Mean", fontsize =22, fontweight='bold')
ax[1].set_title("Median", fontsize =22, fontweight='bold')
ax[2].set_title("Mode", fontsize =22, fontweight='bold')