Understanding your growth model as a system changes how you read data. Instead of looking at metrics in isolation, you start to see how acquisition, retention, and monetization connect, which means the symptom you're seeing isn't always where the real cause lives. That shift is what separates teams who collect dashboards from teams who actually move the needle.
Why is CAC vs LTV the first question in any growth system?
Let's start with a scenario you'll recognize. Imagine your customer acquisition cost is higher than your lifetime value. Is that growth strategy sustainable? If your gut said no, you're already thinking systemically.
Here's how the math works. CAC (customer acquisition cost) adds up your marketing and sales investment, divided by the number of customers acquired in that period [00:24]. LTV (lifetime value) multiplies the average purchase value by purchase frequency and the average duration of the customer relationship, minus acquisition and service costs [00:38].
What is CAC? It's the total marketing and sales spend divided by the number of customers acquired in a given period. If you spent $10,000 and got 100 customers, your CAC is $100.
What is LTV? It's the average purchase value multiplied by purchase frequency and the customer relationship duration, minus acquisition and service costs. It tells you how much a customer is worth over time.
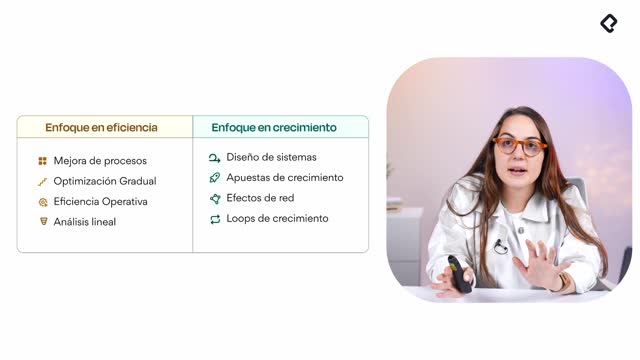
When you understand both, you stop looking at acquisition, retention, and monetization as separate boxes. You start asking how they pull on each other.
Do you really need more data, or better questions?
A common mistake I see in teams: we want more data, assuming that measuring everything leads to better decisions. It rarely does. What you usually need is sharper business questions and the discipline to simulate scenarios before pulling numbers [02:00].
The exercise is simple. Ask yourself: if the result is A, what would I do? If it's B or C, what changes? That way, when the data lands, you already know which lever to pull.
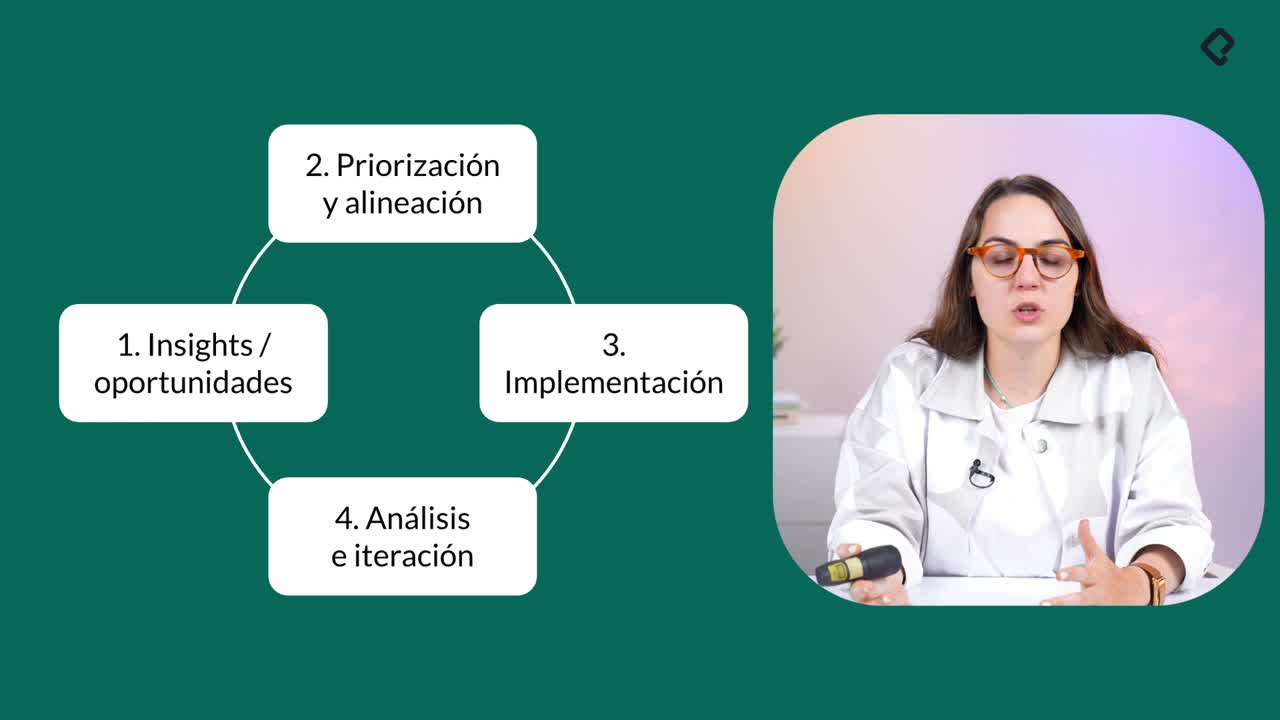
The way I structure metrics work follows three layers:
- Define the expected outcome you want to move.
- Identify predictive indicators (input metrics) that should correlate with that outcome.
- Segment the data to find the specific group where the real insight lives.
A general metric tells you what happened. Segmentation tells you why. And combining quantitative segments with qualitative information is how you build hypotheses worth testing [03:20].
How do you turn a growth hypothesis into measurable input metrics?
Let me walk you through a real example from Datop, a B2B startup I advise. The conversation was about opening new markets in Europe and the United States. Their sales cycle runs 15 days to three months, consultative, with large enterprise clients [04:30].
The acquisition channels were referrals, events, outreach, SEO, and AI tools like ChatGPT and Perplexity that recommend the product directly. So I built a metrics tree starting from the top:
- Top metric: number of new clients in the US and Europe, plus revenue generated from that vertical.
- One level down: I need commercial offers to land clients.
- One level down: I need qualified calls to make offers.
- Bottom: I need each acquisition channel producing those calls.
One insight surfaced fast: Spanish SEO was bringing in users and converting into one of the strongest acquisition sources [06:00]. The bet became obvious. Instead of producing more generic AI content, we'd systematically multiply the content that already worked.
We used Webflow's multilanguage feature to translate every existing page and link into English and Portuguese. Every new piece of Spanish content now ships in three languages at once. That's the input metric: pages and articles published, expected to drive organic traffic, expected to convert a percentage into booked calls.
Within three months, we had calls coming in from the United States and Brazil. The hypothesis held, and the effort was tiny compared to the result. Outreach and other experiments ran in parallel, but this was the channel that scaled [07:30].
How does the metrics map tool help you practice growth analysis?
If you're not used to working with metrics daily, intuition won't show up on its own. You need reps. That's why I built an interactive tool called mapa de métricas with Lobo, available in the course resources [08:45].
Here's how it works:
- Filter by acquisition, retention, or monetization metrics.
- Choose your business model: e-commerce, SaaS, or others.
- Click any node to see the metric definition and trigger a chat that suggests ways to improve it.
- Simulate segmentations by channel, campaign, product, region, or user segment.
For example, click on activation funnel and you'll see it defined as the steps completed during onboarding to reach the first value action, used to identify drop off points and simplify the process. The chat lets you ask things like how to improve MRR and returns alternatives you can pressure test.
What is MRR? It's monthly recurring revenue, the predictable income a subscription business generates each month from active customers.
The tool also includes a growth simulator. If you want to lower CAC and test a hypothesis on which metric to move, you can model it before touching production data.
What should you do with your own metrics map right now?
The goal is for you to understand the metrics tied to your role, depending on whether you sit in acquisition, retention, engagement, or monetization, and connect them to the full system. An isolated metric without context can't generate a real hypothesis.
Two challenges to run this week:
- Build your own metrics map, take a screenshot, mark which metrics you can influence from your role, and connect it to the Notion template we've been documenting.
- Open the simulated dashboard inside the tool, analyze acquisition, retention, monetization, and growth loops, segment the data, and ask yourself what you'd do with each finding.
Knowing the theory only takes you so far. The criterion to generate hypotheses with data shows up when you practice with real scenarios. Drop a comment with the first insight you find when you segment your own data.