Power Query in Excel is the automation and data cleaning tool that turns hours of manual reporting into a single click. If you receive the same file every day and need to consolidate it into one report, this is the workflow that will save you the most time, and it also works inside Power BI if you want to expand your analytics stack later.
What is Power Query and why does it matter?
Power Query lives inside Excel and Power BI as a built-in engine for importing, cleaning, and combining data from multiple sources. Think of it as a pipeline: you connect it once to your origin folder or file, and from that moment on, every refresh pulls the latest version of your data into your spreadsheet.
What is Power Query? It is an Excel and Power BI tool that automates data import, cleaning, and consolidation, so repetitive reporting tasks run in seconds instead of hours.
The real value shows up when you face a recurring task, like merging monthly sales files that share the same structure. Instead of copying and pasting tabs, you let Power Query do the heavy lifting.
How do I combine multiple Excel files from a folder?
The trick is connecting to the folder, not to individual files. That way, anything you drop into that folder later becomes part of your dataset automatically.
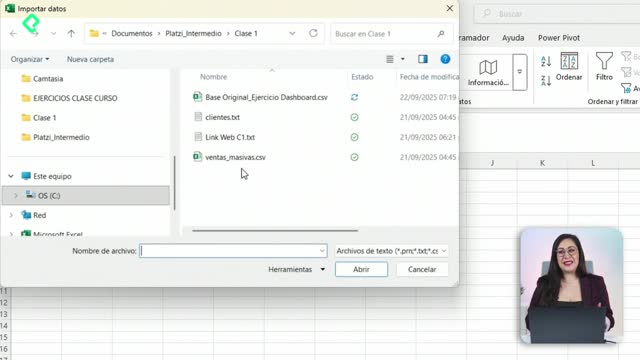
Here is the path you follow inside Excel:
- Open a blank sheet and go to the Data menu.
- Click on Get Data, then choose From File, and finally From Folder.
- Select the folder where all your source files live and click Open.
- Excel shows a preview listing every file detected, for example, sales files from month one to month five of 2024.
- Choose Combine and Load to merge them into a single table.
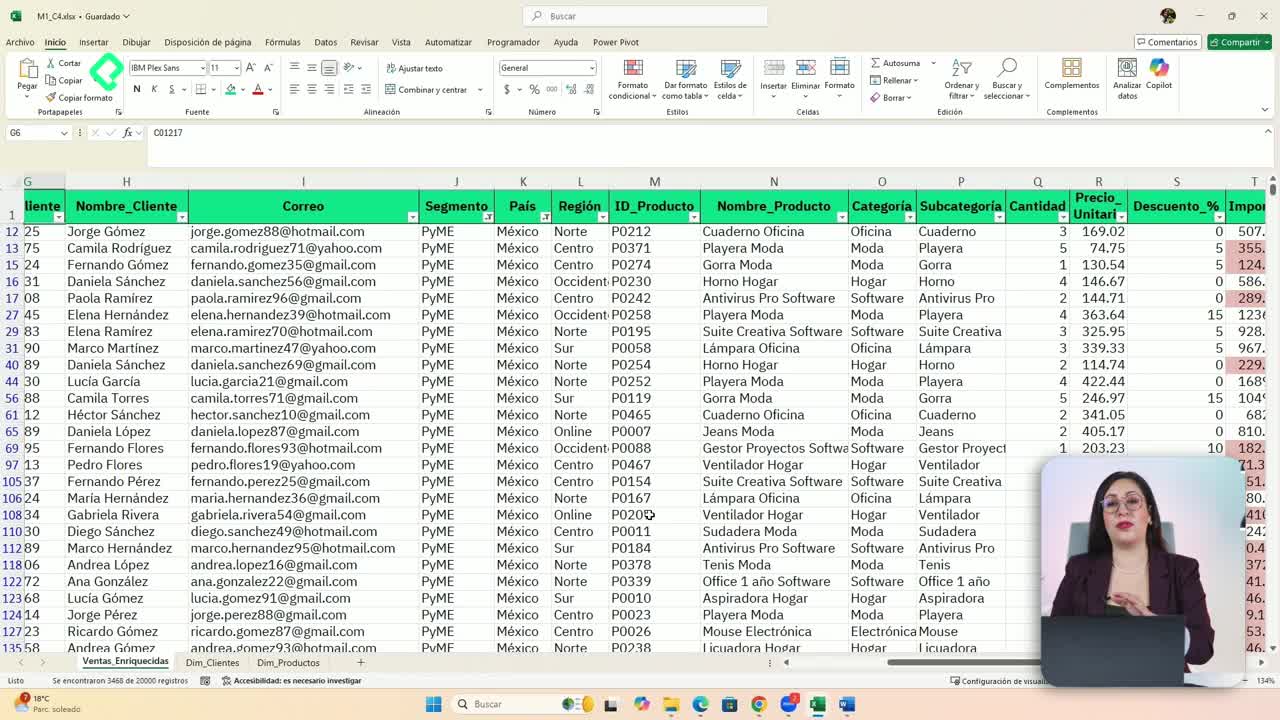
Once you confirm, Power Query unifies everything into one structured table. In the example walked through in class, the consolidation produced 8,172 rows loaded into a single sheet, covering months two through five in one place.
Do all files need the same columns? Yes. For Power Query to combine them cleanly, the source files must share the same column structure. Otherwise the merge will throw mismatches.
What output formats can I choose after combining?
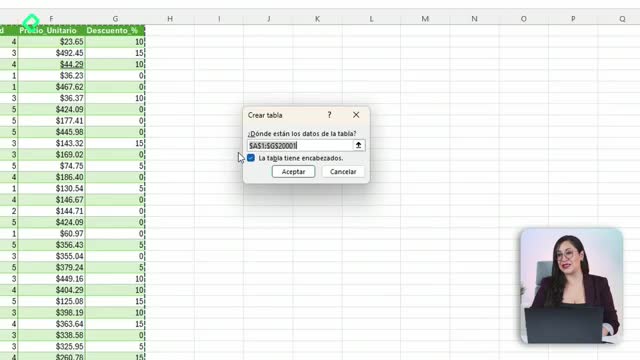
When you load the combined data, Excel offers a few destinations:
- A regular table in a new worksheet.
- A PivotTable directly, ready for analysis.
- A PivotChart if you want to visualize immediately.
Picking the right format depends on whether you want raw data or a summary view from the start.
How do I refresh Power Query when new files arrive?
This is where the automation pays off. Because the connection points to a folder, adding new files updates your report without rebuilding anything.
Imagine you drop the files for month six, seven, and eight into that same folder. To see them in your Excel report, you just need to:
- Open the workbook.
- Locate the Queries panel on the side, where Power Query lists your active connection.
- Click Refresh.
Excel will pull the new files, recount the rows, and update the table. The visible row counter is your quick check: if the number grew, your refresh worked.
Why use a folder connection instead of file by file? Because it acts like a live pipe between your source and your spreadsheet. New files inside the folder flow into your report automatically on every refresh.
What is the one rule you cannot break?
All source files must stay in the same folder. If a file lives somewhere else, Power Query will not detect it and your consolidation will be incomplete. Treat that folder as the single source of truth for the dataset.
Keeping the structure clean is what makes the difference between a report that updates itself and one that breaks every month. Try it with your own recurring files and tell me in the comments which manual task you are planning to automate first.