Moving from basic Excel to a truly professional level means learning how to turn messy files into structured data, build dashboards that answer real business questions, and automate the boring parts. This is the path to unlock advanced Excel skills for data analysis, reporting, and decision making.
What will you learn to do with Excel at a professional level?
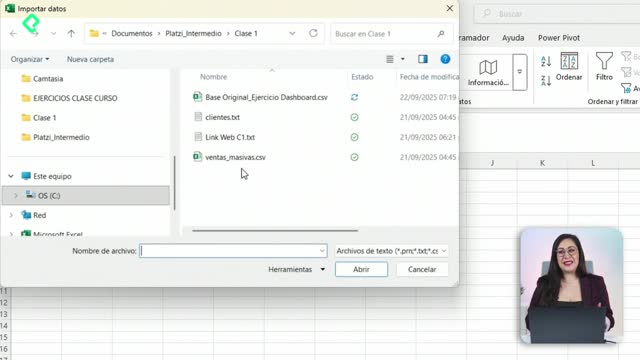
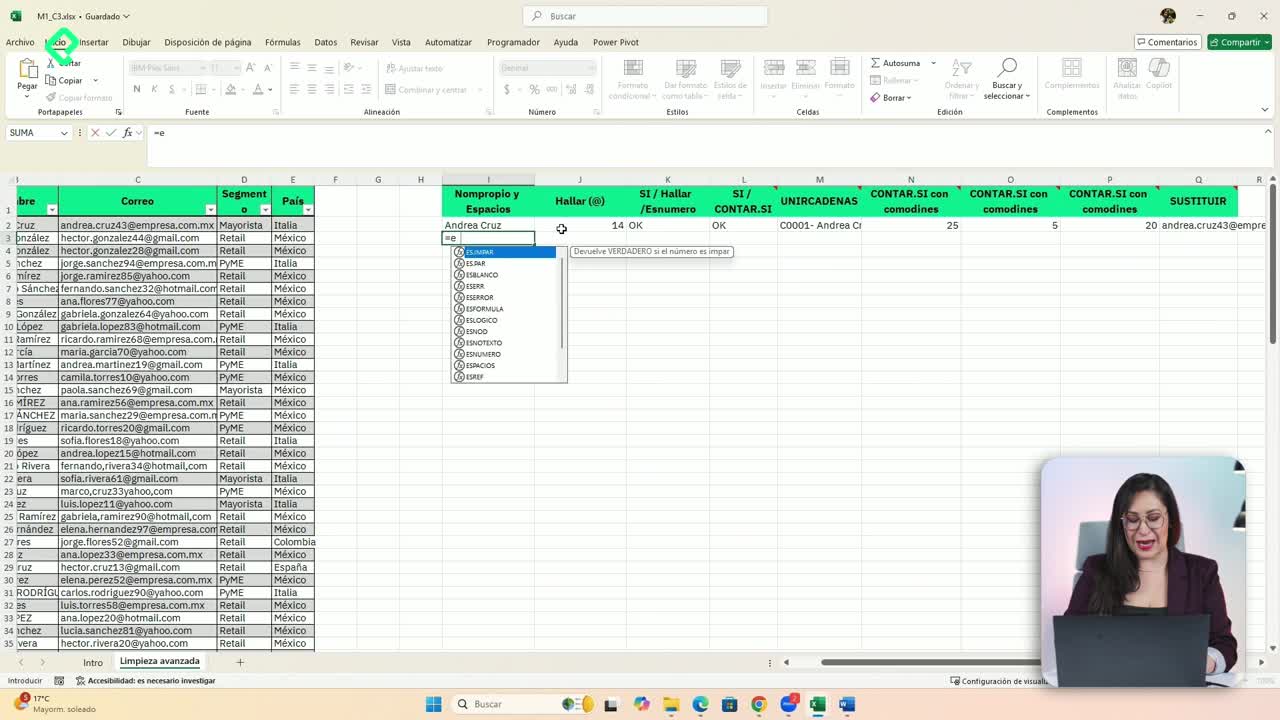
The goal is simple: stop using Excel as a glorified calculator and start using it as a real analysis tool. You will work with raw, disorganized files and transform them into something you can actually read, filter, and trust.
Along the way, you will build skills that go far beyond formulas:
- Convert messy spreadsheets into structured tables ready for analysis.
- Use PivotTables to answer business questions like which products are growing or where money is being lost.
- Create rankings that combine margins and growth to spot what really matters.
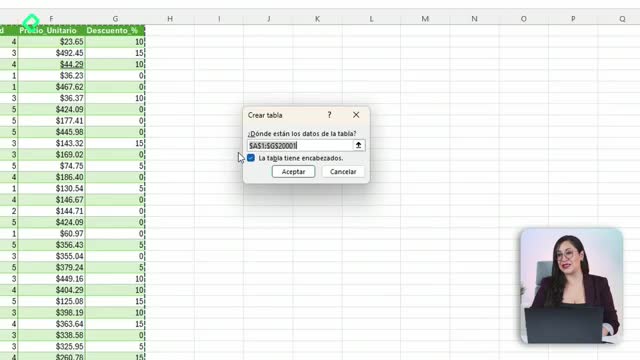
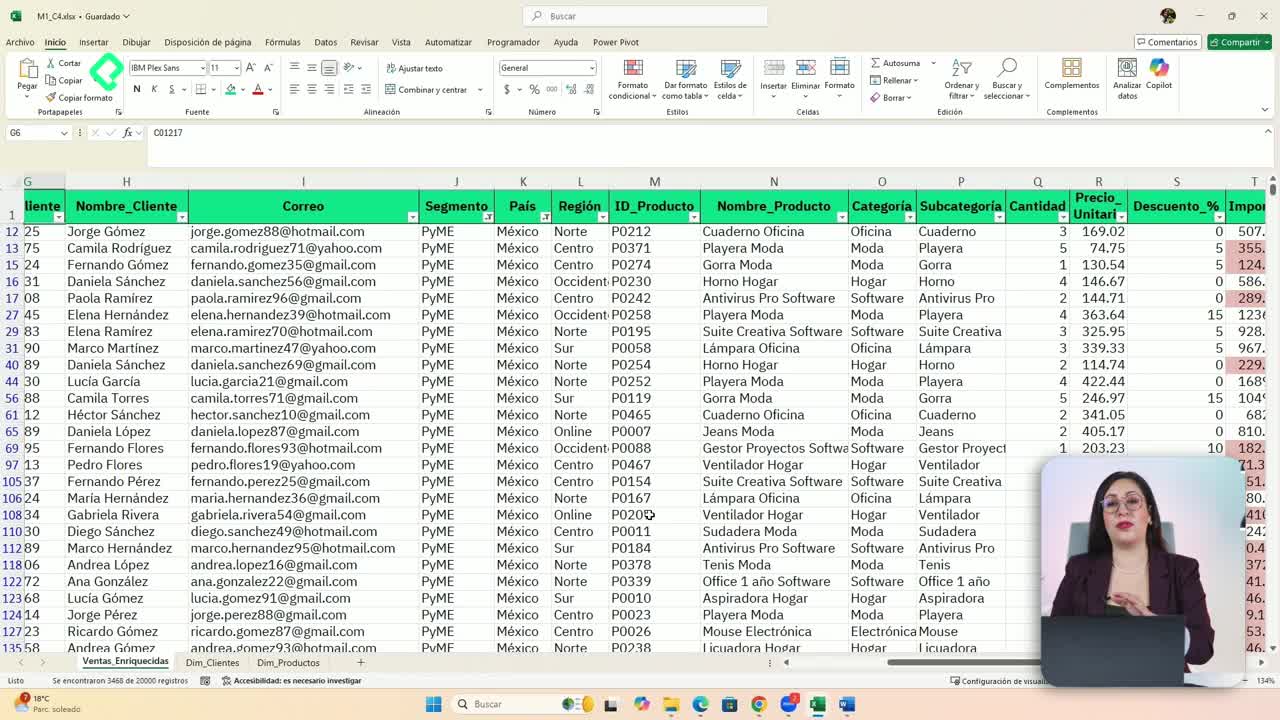
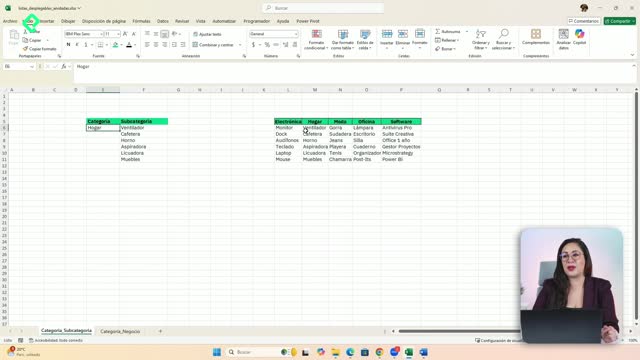
What is a structured table in Excel? It is a dataset organized with clear headers, consistent data types, and no empty rows or merged cells, so Excel can read it as a single block for analysis.
How do PivotTables help you solve real business problems?
PivotTables are the bridge between raw data and decisions. Instead of staring at thousands of rows, you summarize them in seconds and start asking better questions.
With a PivotTable, you can detect which products are climbing in sales, which regions are dragging results down, and how margins behave across categories. That is the kind of insight a manager actually needs on a Monday morning.
And here is where it gets interesting: once your PivotTables are clean, you can plug them into a dashboard.
How do interactive dashboards work in Excel?
A professional dashboard is not just a pretty chart. It is a control panel where you can filter, compare, and simulate scenarios without rebuilding anything.
You will connect your data to an interactive dashboard using:
- Slicers to filter categories with one click.
- Timelines to zoom into specific periods.
- Solver to run simulations and find optimal values for a business goal.
What is Solver in Excel? It is an add-in that finds the best value for a formula by changing other cells under the rules you define, useful for optimization and what-if simulations.
Why should you automate Excel with Power Query?
Because repeating the same cleanup every week is exactly what kills your time. Power Query lets you record the transformation steps once and reuse them whenever new data arrives.
With automation in place, your dashboards and reports refresh in seconds instead of hours. You import the new file, hit refresh, and everything downstream updates: tables, PivotTables, rankings, and visuals.
This is the shift from being the person who makes reports to being the person who reads them and acts on them.
What is Power Query used for? It is an Excel tool to import, clean, and transform data from multiple sources automatically, so you can refresh your analysis without redoing the work.
Who is this professional Excel path for?
If you already know the basics like writing formulas, formatting cells, and building simple charts, this is your next step. You will move into territory where Excel becomes a serious analysis platform: structured data, dynamic reporting, optimization, and automation.
The instructor guiding this journey is Dani Téllez, and the promise is concrete: leave behind basic Excel and start working the way analysts and business professionals actually do.
What is the first messy file you would love to turn into a clean dashboard? Share it in the comments.