Contenido del curso
Módulo 2: Gestión del alcance y aliados de un proyectos
Módulo 3: Gestión del Cronograma de un proyecto
- 11

How Project Schedule Management Works
03:02 min - 12

Dependencias entre actividades para cronogramas de proyecto
06:46 min - 13

Effort vs Duration: The PERT Method
05:49 min - 14

Ruta crítica y cronograma con diagrama de Gantt
05:58 min - 15
PERT and ClickUp for Project Scheduling
07:56 min - 16

Técnicas de compresión de cronogramas: fast tracking y crashing
09:03 min
Módulo 4: Planificación y Presupuesto de Costos
- 17

Gestión de costos en proyectos: procesos del PMBOK y control
04:23 min - 18

Tres métodos para estimar costos de proyectos con precisión
07:34 min - 19

Presupuestos de proyecto con reservas y curva S para control financiero
09:55 min - 20
Building a Project Budget Baseline With S-Curve
Viendo ahora - 21

Why Low Spending Can Hide Project Failure
11:58 min - 22

WSJF and ROI to Prioritize Projects
06:58 min
Módulo 5: Siguientes Pasos
Building a Project Budget Baseline With S-Curve
Resumen
Building a project budget baseline starts with one question: how much will each deliverable actually cost, and how does that money flow over time? Using a drone project as a working example, you will learn how to estimate costs from the ground up, add contingency reserves, and translate everything into an S-curve that lets you track execution month by month.
How do you estimate project costs from the ground up?
The foundation is your Work Breakdown Structure (WBS), where you list deliverables, work packages, and the smaller activities inside them. From there, you apply a bottom-up estimation, which means you start pricing the smallest activities first and roll those numbers upward.
Each small activity feeds into a work package. Each work package feeds into a larger one. And the sum gives you the cost of every deliverable in your project.
What is bottom-up estimation? It is a costing method where you price the smallest activities first and add them up to get the cost of work packages and deliverables. It gives you precision because nothing is guessed at the top level.
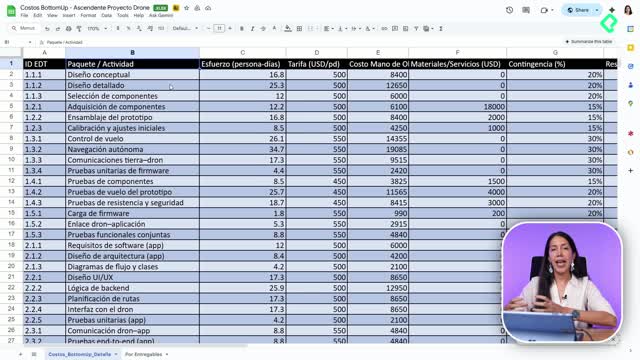
For the drone project, two cost categories are tracked:
- Labor, meaning people, personnel, and human talent.
- Materials and services tied to each activity.
Not every activity carries both. You will see some work packages with a zero in materials because the work is purely human effort, and that is fine.
How do you calculate labor cost per activity?
You estimate the effort each person needs per day to complete an activity, then multiply by their daily rate. The result is the labor cost for that block of work.
Doing this activity by activity keeps your numbers honest. You are not guessing a lump sum; you are building it from real effort and real rates.
Why do you need a contingency reserve in your budget?
Every estimate has uncertainty, and that is exactly what a contingency reserve covers. You and your team assign a percentage to each work package based on how risky or uncertain it feels.
In the drone example, the conceptual design carries a 20% contingency because it might take longer or demand extra effort. Another package gets 15% because materials could end up costing more than planned.
How much contingency should I add? It depends on the risk of each work package. Common ranges are 10% to 25%, and you decide with your team based on uncertainty in time, effort, or materials.
Once you apply those percentages, you get a total value per activity that already includes the cushion. For deliverable one in the example, the math looks like this:
- Labor: $123,000.
- Materials: $29,000.
- Contingency reserve: $32,000.
- Total deliverable cost: $186,000.
That $186,000 is what you will defend in front of stakeholders, because it reflects both the work and the risk. [02:54]
How do you turn cost estimates into a monthly budget?
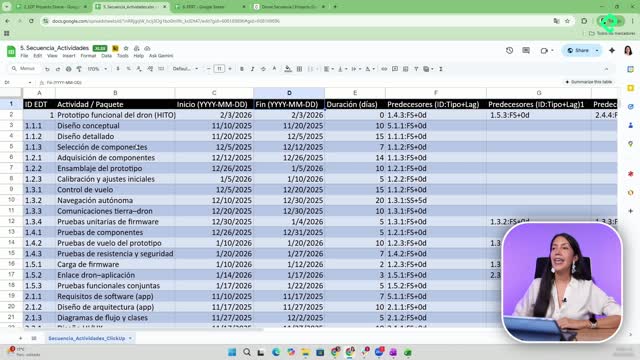
A cost list is not a budget yet. The budget appears when you spread those costs across the months your project will run. For the drone project, that means distributing labor and materials from November through April.
You ask, for each rubro: how much of this gets executed in November? How much in December? January? And so on until the project closes.
This monthly distribution does three things for you:
- Shows what you plan to spend each month.
- Lets you compare planned versus actual as the project runs.
- Feeds directly into your S-curve.
What is the S-curve and why does it matter?
The S-curve is a visual of accumulated spending over time. When you plot the monthly budget, you usually see a steep climb at the start and a flatter tail at the end.
In the drone project, the curve climbs hard in the first months because most material purchases and early labor happen up front. Toward the end, only a few final purchases remain, so the curve flattens. [05:09]
What does an S-curve show? It shows accumulated project spending over time. A steep early slope means heavy upfront costs; a flat tail means execution is winding down.
How do you track execution against the planned budget?
A second tab in the template handles execution. You bring in the planned figures for each month and, as the project moves, you record what was actually spent.
For November, the plan was $70,000 in labor and $1,500 in materials and services. As you execute, you check whether you hit those numbers, went over, or underspent. The contingency reserve, also distributed monthly, gives you room to absorb small deviations without breaking the baseline.
This comparison tells you immediately if you are desfasado, meaning over budget or underexecuting. And because most companies close their books monthly, this rhythm matches naturally with your finance team's reporting cycle.
How can you adapt the template to your own project?
The two-rubro setup (labor and materials) is intentional for clarity, but you can expand it as much as your project needs. A few ways to extend it:
- Split materials and services into separate rows.
- Add training, licenses, or travel as new rubros.
- Add more time columns if your project runs longer than six months.
Monthly columns work well because they align with accounting cycles, but you can adjust the granularity to fit how your team operates.
Now it is your turn. Take the template, plug in your own work packages, and build the baseline for whatever you are launching. Tell me in the comments which rubro gave you the most trouble to estimate.